AI crawler mix: OpenAI went from 94.8% to 79.8% of verified requests
OpenAI's share of IP-verified AI crawler requests fell from 94.8% to 79.8% between June and September 2026. What a falling share means, and which crawler-log tools to use.
A falling share is the most misread number in crawler analytics. Promptwatch's AI crawler traffic report shows OpenAI's share of IP-verified AI crawler requests dropping from 94.8% in the week of June 8 to 14, 2026 to 79.8% in the week of August 31 to September 6, 2026. The page calls OpenAI "the biggest mover". Read quickly, that sounds like OpenAI crawling less. The report doesn't say that, and the math doesn't require it.
This post is about reading that number correctly, comparing it with your own logs, and choosing a crawler-log tool that verifies requests the way the report does. Our earlier write-up of the weekly provider mix covers the report's definitions and a robots.txt checklist; we won't repeat those here.
What the report measures, briefly
The chart shows 13 weekly bars from June 8 to the week starting August 31, with five providers: OpenAI, Anthropic, Perplexity, Google, and Mistral. Requests count only if the source IP matches the operator's published IP ranges, weeks run Monday to Sunday in UTC, and shares are across all tracked logs for that week. The page groups by provider by default; it can also group by crawler. Only OpenAI's two figures are stated in the text. The other providers' values appear on hover in the chart, and we don't quote them.
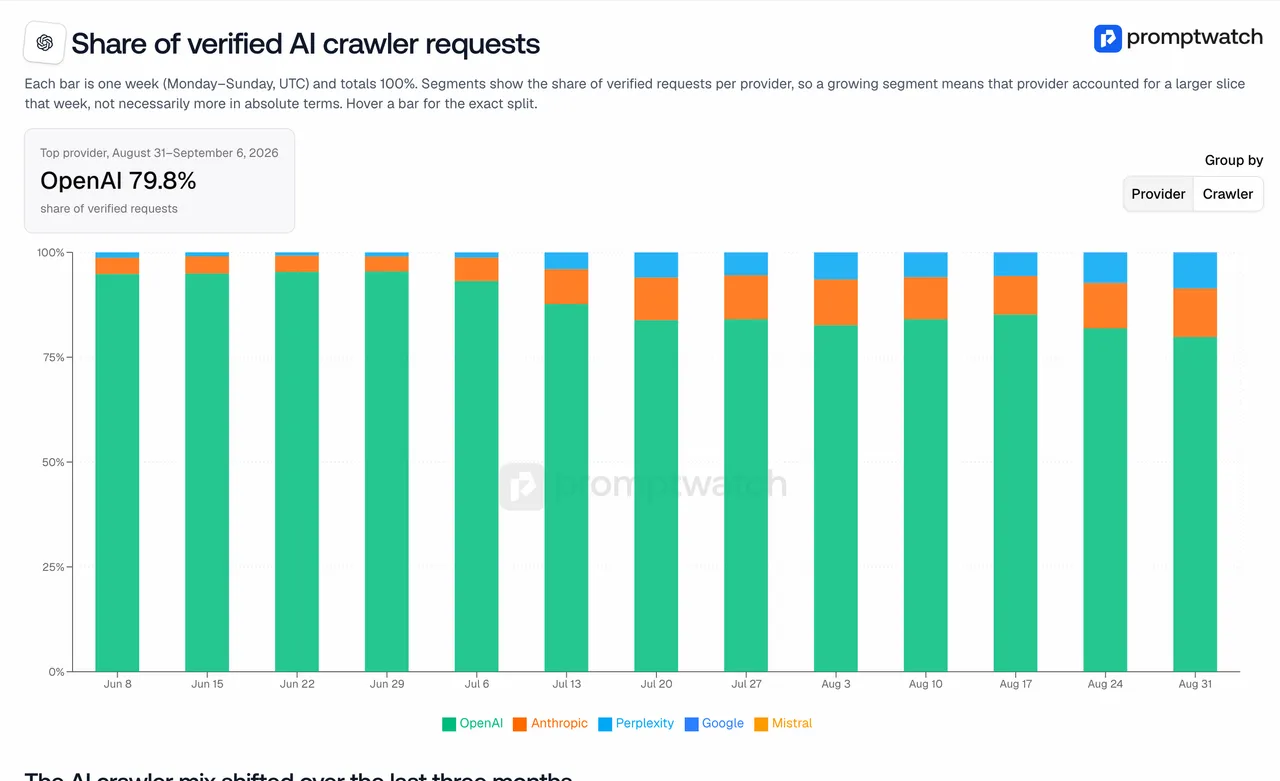 Promptwatch's "Share of verified AI crawler requests" chart (weeks of June 8 to August 31, 2026; the page had not updated past September 6 when captured), captured November 14, 2026.
The page is built as a rolling window, but when we checked on November 14 it still ended at the August 31 to September 6 week. Cite it with that week.
Why a smaller share doesn't mean fewer visits
Each week's shares add up to the whole. If one provider grows, everyone else's slice shrinks, even if their request counts haven't moved.
Here is a simple illustration with made-up round numbers. Suppose a site gets 950 verified requests a week from OpenAI and 50 from everyone else. OpenAI's share is about nineteen in twenty. Now suppose OpenAI keeps sending exactly 950 requests, while the other providers grow to about 240. OpenAI's share falls to roughly four in five. OpenAI changed nothing. The others got busier.
The report itself makes this point: a growing segment means a larger slice, "not necessarily more in absolute terms." So the September figure from the crawler traffic report supports two safe statements. OpenAI was still about four in five verified AI crawler requests in the week of August 31 to September 6, 2026. And the non-OpenAI providers became a bigger part of the mix over the summer. It does not tell you whether any single provider's absolute volume went up or down.
What else the provider view hides
Training versus answer time. The page notes that provider totals hide the split between training crawlers and answer-time fetchers. An OpenAI total lumps GPTBot, OAI-SearchBot, and ChatGPT-User together, and those do different jobs. Our guide to what each AI crawler does covers the differences.
Providers that aren't in the chart. Meta and xAI are not among the five providers. Promptwatch's separate Meta-WebIndexer report counts by user agent rather than by IP, so its numbers can't be combined with this chart. If Meta's crawlers are busy on your site, this report won't show it. We covered that crawler in Meta-WebIndexer's crawler share.
Your site. The report aggregates logs across sites connected to Promptwatch. Your mix depends on your content, your category, and what you block.
How to compare your logs with the benchmark
The report's advice is to compare your own logs with the published mix: a provider that's sizeable in the benchmark but close to zero in your logs points to a block or an access problem. Here's how we'd run that comparison so the result means something.
- Use the same verification. If your logs trust user agents, a scraper pretending to be GPTBot inflates OpenAI's share. Compare IP-verified to IP-verified.
- Use the same unit. Weekly, Monday to Sunday UTC, matches the report.
- Compare by crawler, not only by provider. If OpenAI is nearly all of your AI traffic, find out whether it's GPTBot or ChatGPT-User. A site that only sees training crawls is in a different position from one that sees answer-time fetches.
- Look for the near-zeros. A provider you never see is the lead worth chasing. Check robots.txt, then the CDN and WAF rules above it.
- Check the crawl-to-citation link. Crawls only matter if they lead somewhere. A page that gets crawled often but is never cited has a content problem, not an access problem.
The measurement step
Promptwatch's Agent Analytics uses the same method the report does: real-time crawler logs checked against each operator's published IP ranges, so spoofed user agents are filtered out. It logs named bots, including GPTBot, OAI-SearchBot, ChatGPT-User, ClaudeBot, Claude-User, Claude-SearchBot, PerplexityBot, Perplexity-User, Google-Agent, GoogleOther, MistralAI-User, and Meta's crawlers. A few details from recent changelogs matter for this comparison:
- Since November 4, search indexers such as OAI-SearchBot and Claude-SearchBot count as AI crawls, and citation crawls are only bots that fetch a page while answering a user, such as ChatGPT-User. If you compare old and new exports, the categories shifted.
- Since November 6, Exa's ExaSearchBot and ExaUser are tracked too, without a Verified badge, because Exa publishes no IP ranges.
- Since November 13, a Host column flags logs from hostnames that aren't the project website, so requests for other hostnames don't quietly skew your mix.
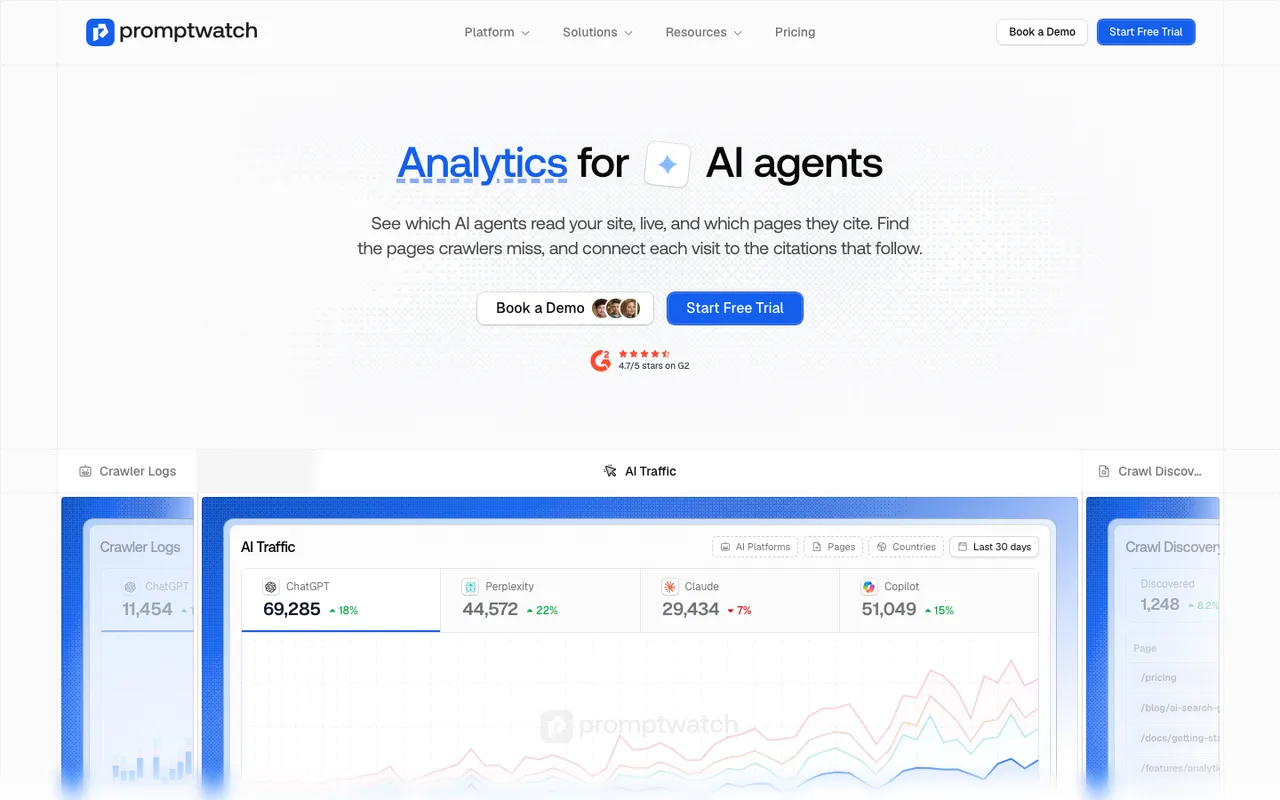 Promptwatch's Agent Analytics page, captured November 8, 2026.
The crawl-to-citation path shows a citation rate per page, which is step five above in one view. Crawler logs start on Professional at $245 a month; Essential ($95) doesn't include them. Logs arrive through Cloudflare, AWS CloudFront, Fastly, Vercel, Netlify, Akamai, Google Cloud CDN, a custom HTTP endpoint, or the WordPress plugin.
Crawler-log tools, ranked on verification and crawl-to-citation
We ranked on IP verification first, bot coverage second, and whether the tool links crawls to citations third.
- Promptwatch. IP-verified logs, named-bot coverage across OpenAI, Anthropic, Perplexity, Google, Mistral, Meta, and Exa, crawl-to-citation rate per page, error tracking, and prompt tracking in the same workspace. From $245 a month for crawler logs.
- Known Agents. Agent Analytics with spoof verification, using IP or HTTP message signature checks where supported, plus AI chat referral tracking. Free tier at 100K events; Startup $29 a month, Growth $299. Its citation counts are estimates inferred from agent fetches, and it doesn't track prompts.
- Cloudflare AI Crawl Control. Free on every Cloudflare plan and groups crawlers by operator, which maps neatly onto the report's provider view. On the Free plan, crawlers are identified by user agent only, so it doesn't match the report's IP method. No citation data.
- Scrunch AI. Our catalog lists AI agent and bot traffic reporting alongside its monitoring. Core is $250 a month. Crawl-to-citation paths and IP verification aren't documented in our entry.
- Ahrefs Brand Radar. Reports on AI crawler activity as part of the module. Our entry doesn't document IP verification or crawl-to-citation linking.
To see where your own logs differ from the benchmark, start a 7-day free trial of Promptwatch on the Professional plan with monthly billing, connect your CDN logs, and compare a full Monday-to-Sunday week against the report's last published week.