Google AI Mode citation share, February to June 2026: google.com went from 0.79% to 7.31%
Five months of Promptwatch's Google AI Mode citation share reports, from YouTube's March jump to google.com taking first place, plus the tools that track it per domain.
In February 2026, Google's own properties earned 0.79% of the citations in Google AI Mode answers, according to Promptwatch's February report (February 1 to 28). In the June 1 to 27 window of the June report, google.com earned 7.31%, more than YouTube and Reddit put together. Promptwatch published a citation share report for AI Mode every month in between, and the path between those two endpoints is lumpier than the headline suggests. Below we go month by month, separate what each report shows from what it doesn't, and finish with a ranked list of tools that can show AI Mode citations per domain for your own prompts.
A word on method before the numbers. Each report counts citations "tracked from real prompt responses using Google AI Mode" and ranks domains by their share of all citations that month. No report publishes a sample size. The charts show more domains than the text quotes, and we only use figures the reports state in writing. The June report stops on June 27, so every June number here is month-to-date.
February: a flat field
The February 2026 AI Mode report (February 1 to 28) is the baseline. YouTube led with 1.88%, Reddit followed at 1.41%, LinkedIn had 0.86%, and what the page calls "Google's own properties" had 0.79%. Facebook sat at 0.77%. Medium, at 0.38%, was the highest-ranked traditional content site. The page's summary: no domain reached even 2%.
A field that flat is good news for mid-sized sites. When the top source has under 2% of citations, as in the February 1 to 28 report, the other slots are scattered across a huge number of pages, and a focused page on a narrow question has a real shot. The February page attributes the scatter to AI Mode's query fan-out, where one question turns into several searches that each pull their own sources.
March: YouTube pulls away
The March report (March 1 to 31) is YouTube's month. Its share went from 1.88% to 3.30%, which the page calls a 76% jump, and it finished at double Reddit's 1.65%. LinkedIn held at 0.89%. Forbes, the best-known publisher the text names, managed 0.17%. Six of the top seven domains were video, social, or community platforms.
The smaller moves in the March comparison (February vs March 1 to 31) are just as telling. TikTok went from 0.05% to 0.16%. Yelp fell from 0.37% to 0.15%, losing more than half its share in a month. Google's own domain slipped from 0.79% to 0.58%. Anyone who read March in isolation would have concluded that Google was citing itself less, which is exactly the wrong lesson for the months that followed.
April: same order, restless mid-tail
The April report (April 1 to 30) repeated March's ranking. YouTube had 3.34%, Reddit 1.64%, LinkedIn 0.84%, Facebook 0.81%, Google's domain 0.71%, Medium 0.39%. Below the top two, nothing reached 1%.
Movement happened lower down, in the April report's March vs April comparison. google.com went from 0.58% to 0.71%, a 22% rise in the page's terms. Amazon dropped from 0.16% to 0.09% and Quora from 0.17% to 0.12%. Tripadvisor eased from 0.22% to 0.17%. The page warned that the mid-tail was where AI Mode's behavior was still in flux. Looking back, the google.com uptick was the opening act.
May: google.com takes first place
The May report (May 1 to 31) is where the series breaks. google.com went from 0.71% to 4.24%, roughly sixfold, and became the most cited domain "for the first time in this series". YouTube dropped to second at 3.42%, and Reddit rose 44% to 2.36%. Google-owned properties together came to roughly 7.7%, and no other domain in the list cleared 1%.
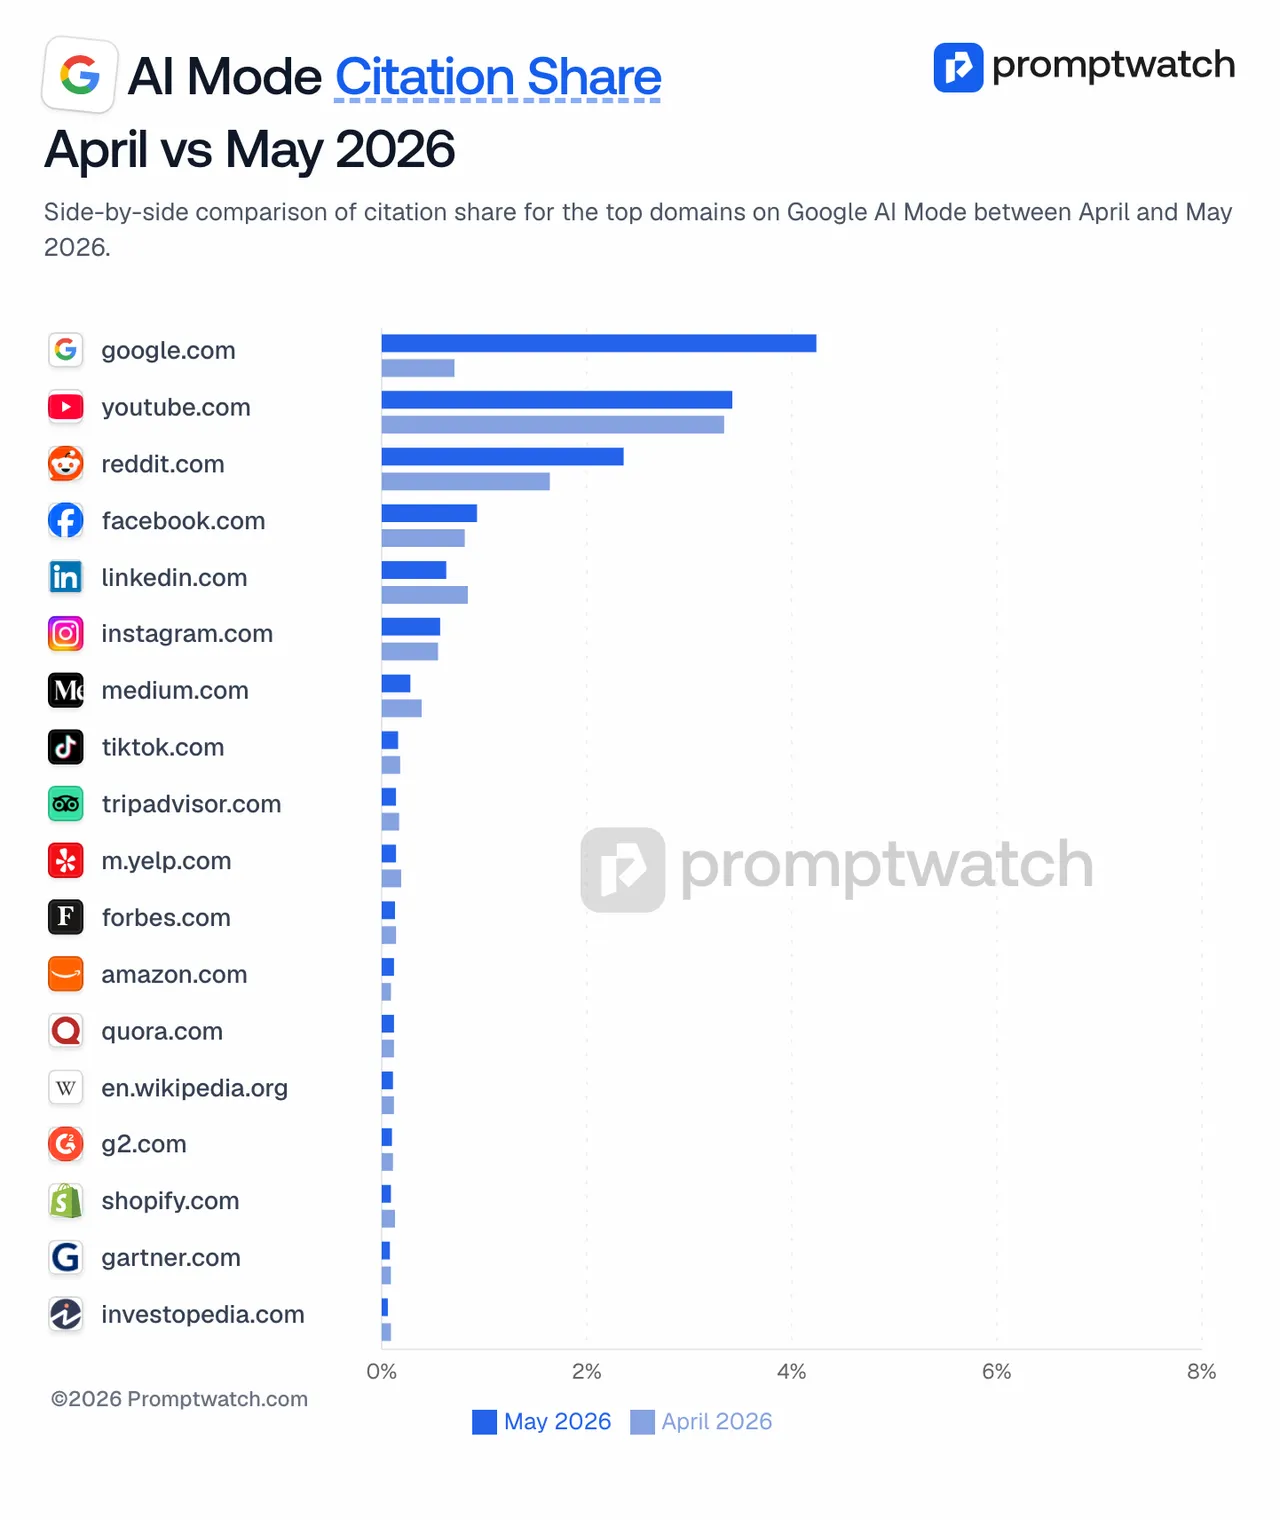 Promptwatch's "AI Mode Citation Share, April vs May 2026" chart, captured November 14, 2026.
The publishing platforms lost ground in the same May 1 to 31 report. LinkedIn fell from 0.84% to 0.63% and Medium from 0.39% to 0.28%, and the page says both lost about a quarter. Its comment on the month is worth pinning above a content calendar: the channel mix you optimized for in April was already outdated by May.
June, month-to-date: google.com doubles again
The June report covers June 1 to 27. In that window google.com reached 7.31%, up 72% on May and more than YouTube (2.88%) and Reddit (2.52%) combined. Google-owned properties passed 10%. YouTube's slide from 3.42% to 2.88% was its first decline in the series. Instagram went from 0.57% to 0.68%, and Quora from 0.12% to 0.18%.
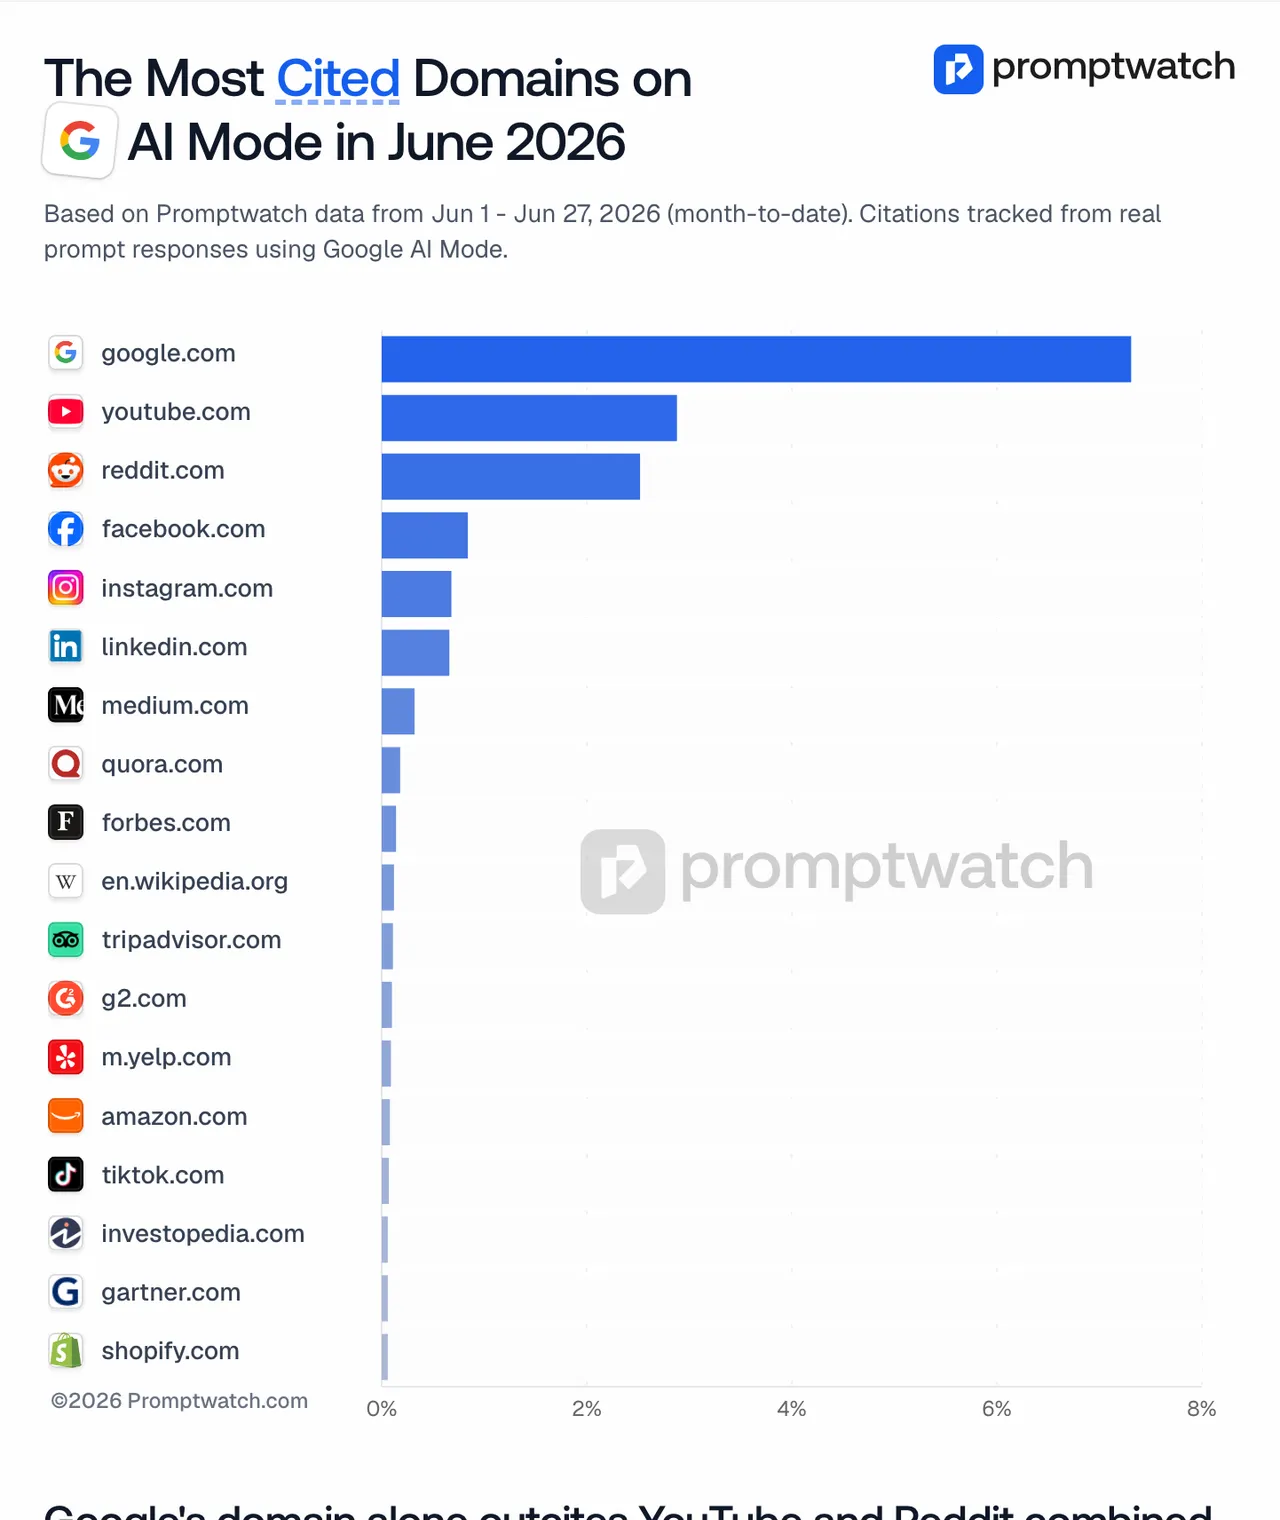 Promptwatch's "The Most Cited Domains on AI Mode in June 2026" chart (June 1 to 27, month-to-date), captured November 14, 2026.
The page adds its own caution: June is month-to-date, and the YouTube dip "may deepen or reverse". Twenty-seven days is most of a month, but partial windows tend to flatter fast risers.
The series in one table
The table collects the domains the five reports quote most often. "Not stated" means that month's text gives no figure, even if the chart shows a bar.
| Domain | Feb | Mar | Apr | May | Jun (Jun 1 to 27) |
|---|---|---|---|---|---|
| google.com | 0.79% | 0.58% | 0.71% | 4.24% | 7.31% |
| YouTube | 1.88% | 3.30% | 3.34% | 3.42% | 2.88% |
| 1.41% | 1.65% | 1.64% | 2.36% | 2.52% | |
| 0.86% | 0.89% | 0.84% | 0.63% | not stated | |
| Medium | 0.38% | not stated | 0.39% | 0.28% | not stated |
Each column comes from its own report: February (Feb 1 to 28, where the google.com figure is the page's "Google's own properties"), March (Mar 1 to 31), April (Apr 1 to 30), May (May 1 to 31), and June (Jun 1 to 27, month-to-date).
What the five months say, and what they leave open
Our read of the table comes down to three points. The leader changed: YouTube from February to April, google.com from May. Reddit climbed steadily in AI Mode with no cliff, a very different shape from what happened to Reddit in ChatGPT in August (we cover that in Reddit in ChatGPT before and after August 14). And the rented publishing platforms, LinkedIn and Medium, lost share in the same month google.com surged.
The reports do not explain why google.com rose. They don't split it into Maps, Business Profiles, Shopping, or search result pages, so you can't tell from the data which Google surface is taking the slots. One likely reason is that AI Mode began pointing people back into Google's own listings and results more often. The May page's advice to "turn your Google listings into citation assets" fits that reading, but it is interpretation, not a measured cause.
Keep the scope in mind too. These are shares across the prompts Promptwatch tracks, not your category. A B2B software brand and a dental clinic chain could see very different google.com shares, and the only way to know yours is to measure your own prompts.
How to check AI Mode citations for your brand
Start with a monitor built from the questions your buyers actually ask, and run it on Google AI Mode next to Google AI Overviews. Running both shows whether the two Google surfaces cite your category the same way. Our earlier piece on AI Mode vs AI Overviews citation share compared the two for June; this one follows AI Mode alone across five months.
Then read citations rather than mentions. In Promptwatch, the All Citations and URL Positions tabs list every domain and URL an answer cited, with competitor domains highlighted, and Citation Trends shows how a domain's citation rate moves over time. That is where you would see whether google.com is crowding your pages out. Page Tracker follows specific URLs, yours or a rival's, along with the prompts and responses that cite them.
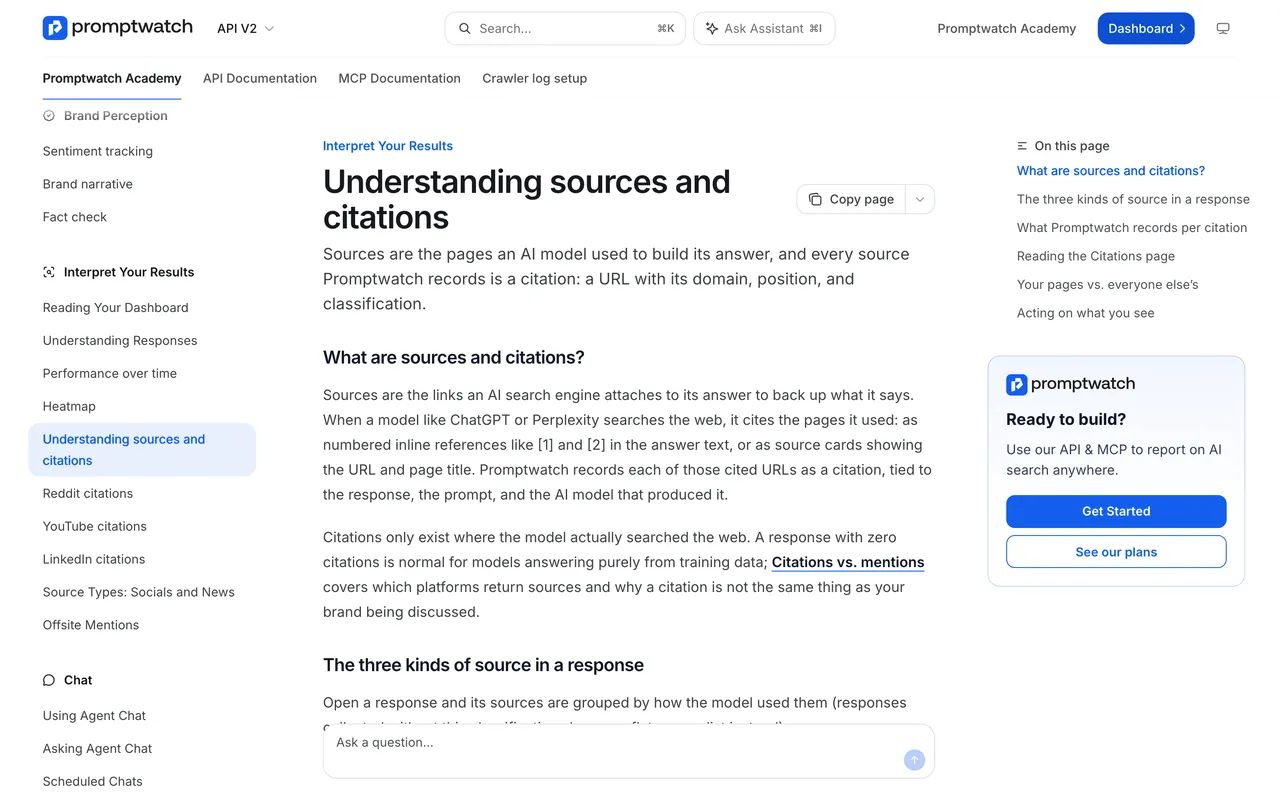 Promptwatch Academy, "Understanding sources and citations", captured November 14, 2026.
Local businesses should test location as well. With local GEO/SEO targeting, a monitor can be pinned to exact coordinates; Google AI Mode then uses the nearest named area to that point. After the November 6 fix, AI Mode answers landed in the pinned metro 46 of 48 times in Promptwatch's own test, up from 32. Coordinate targeting is on Business ($579 a month), Agency Scale, and Enterprise.
Tools that show AI Mode citations per domain, ranked
We ranked tools on three questions. Does it track Google AI Mode? Does it show which domains and URLs each answer cited? Can it show change month over month?
- Promptwatch. Monitors Google AI Mode through the real interface, alongside ChatGPT, Google AI Overviews, Gemini, Perplexity, Copilot, Amazon Alexa, and Meta AI. Citation analytics go down to the URL, and Citation Trends sorts citations into 22 content types and 20 source types. Essential starts at $95 a month; city and coordinate targeting start on Business.
- AthenaHQ. Our catalog entry lists AI Mode among the engines on its Starter tier, which is $295 a month for 3,600 credits (one credit is one AI response). Citation analytics at domain and URL depth are not documented in the entry.
- Scrunch AI. Core, at $250 a month, tracks four LLMs: ChatGPT, Perplexity, Google AI Overviews, and Copilot. AI Mode is not on that list. Enterprise adds nine LLMs at a custom price.
- Profound. Our entry lists AI Mode among the engines available on Enterprise, which is custom-priced (an earlier estimate put it near $40k a year). The free trial covers ChatGPT, Gemini, and AI Overviews only.
- Ahrefs Brand Radar. The AI Visibility Index covers AI Mode among six surfaces from $199 a month, but its prompts are modeled from keyword data and the question sets are retested monthly, so it is slower to show a shift like May's.
The easiest way to see your own version of this table is a 7-day free trial of Promptwatch on monthly billing: add an AI Mode monitor with your top buyer prompts, wait for a few daily runs, and open URL Positions to see which domains are taking the slots.