AI brand perception vs brand sentiment: why one score is not enough
A sentiment score compresses AI answers into one number. Perception is the claims underneath. How a neutral score can hide a damaging claim, and which tools show both.
A sentiment score is a summary. Perception is the evidence the summary was built from. You need the score to notice that something moved, and you need the claims to know what moved and what to do about it. Teams that only watch the score tend to find out about a damaging claim late, because a single specific criticism can sit inside a perfectly neutral average for months.
This piece explains how AI sentiment scores are built, shows how one can hide a problem, and sorts the tools on this site by whether they show you claims or only a number.
How an AI sentiment score is built
Promptwatch documents its method in detail, so we'll use it as the reference. Each response that discusses your brand gets a sentiment score on a 100-point scale, where around 50 is neutral. Praise, recommendations and favorable comparisons push the score up. Criticism, caveats and unfavorable comparisons pull it down. Promptwatch's own examples: "the best in class" lands near the top, "works but has important limitations" lands in the low 40s, and "BrandX provides the listed features" is a plain 50.
Three rules shape the number you see:
- Every statement counts, weighted by strength. Mixed coverage ("solid choice, but support can be slow") balances out toward the middle rather than following the last sentence.
- Prominence doesn't leak in. Being listed first or mentioned three times does not raise sentiment; that's what the visibility score is for.
- Thin mentions get no score. If your brand appears only as a bare name in a list, the response records no sentiment instead of a fake neutral 50.
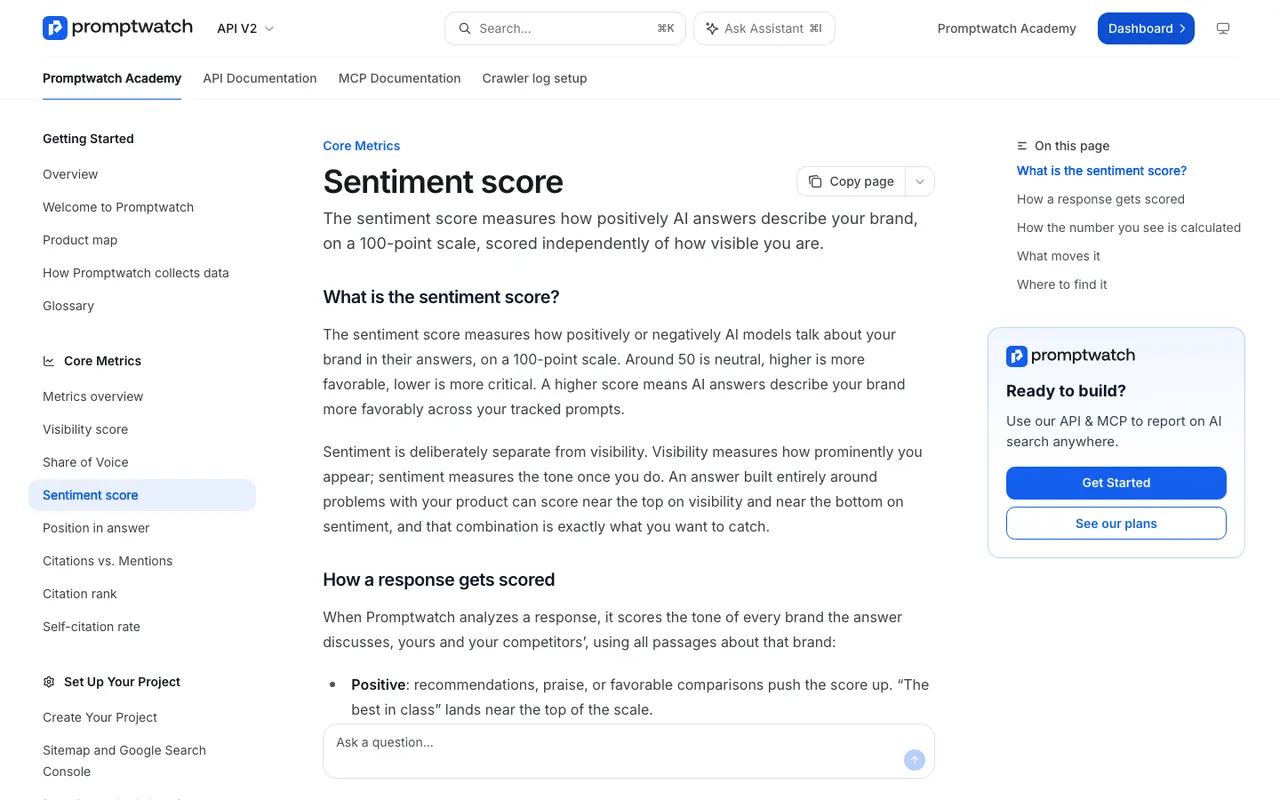 Promptwatch Academy's Sentiment score page, captured November 14, 2026.
That is a careful design. It still produces one number per response, and averages of those numbers per day. The average is where detail goes missing.
How a neutral score hides a damaging claim
Take a hypothetical HR software company we'll call Acme. Here's an illustrative month of answers to its tracked prompts, simplified to show the mechanics.
Most answers are warm about onboarding: "Acme is easy to roll out", "teams are usually live within a week". Those land well above 50. A smaller group of answers to enterprise comparison prompts includes a sentence like "Acme doesn't support single sign-on, which rules it out for larger companies." Those land well below 50. A third group just lists Acme among options with no judgment, and those aren't scored at all.
Average the scored answers and Acme sits somewhere in the mid-50s. On a dashboard that reads as "roughly neutral, slightly positive, stable". Nobody escalates a stable mid-50s.
Now suppose Acme shipped single sign-on six months ago. The claim is wrong, it appears specifically in the prompts enterprise buyers ask, and it disqualifies Acme from exactly the deals it wants. The score can't tell you any of that. It can't even tell you that the negative answers share one cause, because a hundred mild caveats and ten copies of one serious factual error can produce the same average.
The general pattern: a sentiment average answers "how warm is the coverage overall?" Perception answers "what are engines saying, how often, and is it true?"
Reading sentiment well before you go deeper
The score is still worth watching, as long as you read it the way Promptwatch's Academy suggests: judge the level once and investigate every movement. A stable 55 is a fact about your brand. A drop from 70 to 55 in two weeks is an event with a cause. And check the volume behind the line, because on days with few mentions one harsh response can swing the daily average.
The drill-down is where sentiment tracking earns its keep. Promptwatch's Sentiment page filters responses into four score bands (below 30, 30 to 50, 50 to 75, 75 to 100), and selecting below 30 is the fastest route to the damage. The By Prompt tab sorts prompts lowest score first, so you can see which questions keep producing negative answers. Open a response and you see the full text and the sources it cited. Promptwatch notes that comparison prompts usually score lower than informational ones, since they weigh you against rivals, so compare like with like.
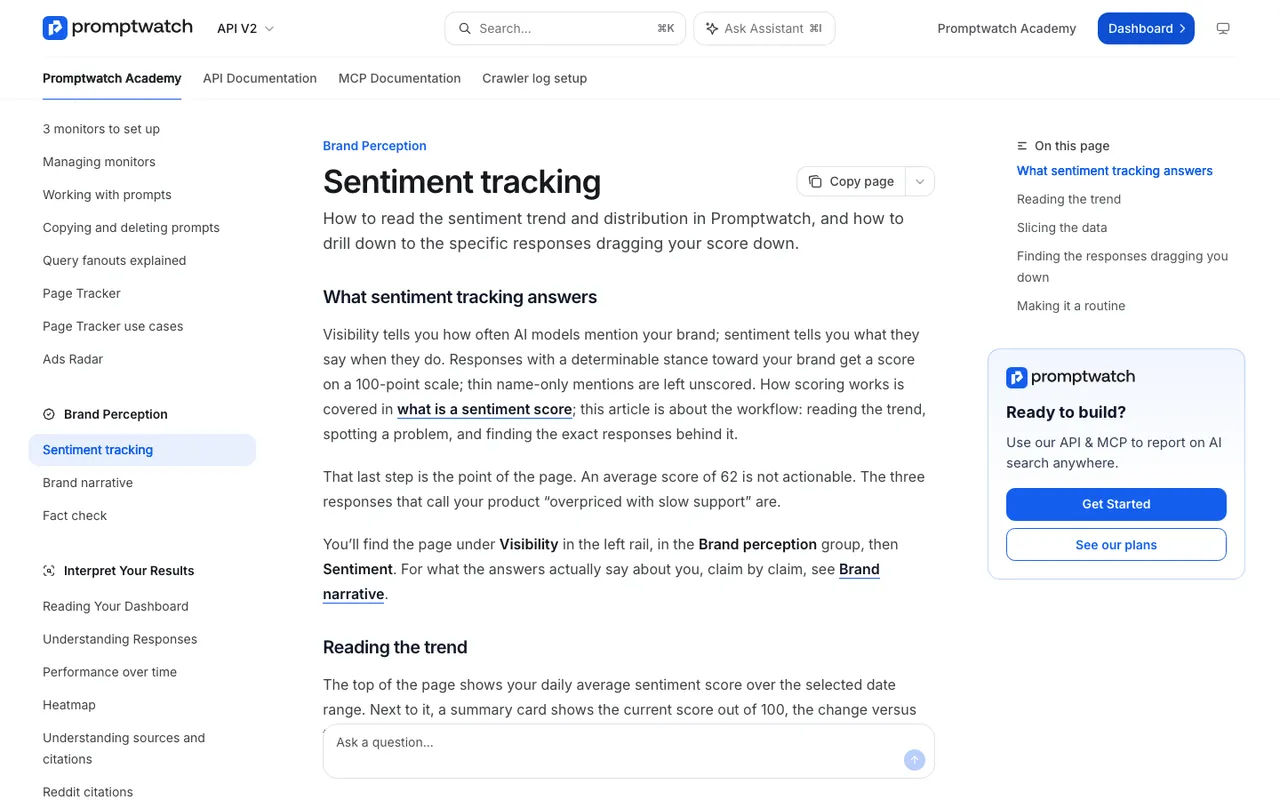 Promptwatch Academy's Sentiment tracking page, captured November 14, 2026.
That workflow gets you from the score to the responses. You still have to read them, and with hundreds of responses a week that's where teams give up.
The claim layer
Claim-level tools do the reading for you. Promptwatch's Brand Narrative, included on every plan, pulls each claim about your brand and tracked competitors out of every response as a verbatim quote of at least four words. Repeats are grouped, so ten phrasings of "doesn't support single sign-on" become one claim with a count and a list of the models that say it.
Claims are filed under nine themes: Pricing, Features, Quality, Usability, Range, Support, Reputation, Audience and Company. Each quote is scored 0 to 100, with below 40 negative and 60 and up positive, and a grouped claim is labeled Mixed when its quotes fall into more than one band. A theme's score is the average of its quotes, so you can see that Acme scores high on Usability and low on Features, and that the Features score is dragged down by one recurring claim.
The claims table opens with the most negative claims. In the Acme case the SSO claim would sit near the top, tagged Features, with its count and the enterprise comparison prompts behind it. Its Citations tab shows the pages cited alongside it, perhaps an old review that predates the feature.
On Business ($579 a month), the agency Scale plan and Enterprise, Fact Check takes the next step. You mark the claim Inaccurate, and the check reads your site and up to 50 of the most-cited pages, then reports whether they confirm the claim, conflict with it or say nothing. If your own help center still says SSO is "coming soon", the check finds that sentence.
When a score is enough and when it isn't
A score is enough when you're tracking direction for a report, comparing tone across engines at a glance, or deciding whether to look closer. It isn't enough when you need to know what to fix, when a claim is factually wrong rather than unflattering, or when the criticism is concentrated in one audience or one theme.
In practice you want both on the same screen: the score to trigger attention, the claims to direct the work.
Which tools show claims, which show only scores
From our catalog entries:
| Tool | What it reports about tone and content |
|---|---|
| Promptwatch | Sentiment per response plus Brand Narrative claims, themes and theme scores on every plan; Fact Check on Business and up |
| Evertune | Brand attribute and sentiment tracking |
| Temso AI | Sentiment and brand-attribute tracking |
| Muck Rack Generative Pulse | Sentiment and narrative tracking |
| AthenaHQ | GEO score with sentiment analysis |
| Scrunch AI | Sentiment analysis |
| Brand24 | AI Brand Score, Presence Score and sentiment |
"Attribute" and "narrative" tracking suggest more than a score, but only Promptwatch's documentation describes verbatim claim extraction, theme grouping and per-claim sources in detail. Ask the others for a sample export before you assume parity.
Where to start
If you already track sentiment, keep doing it, and add the claim layer underneath. Start the Promptwatch 7-day free trial, let your prompts run for a week, then open Brand Narrative's Negative tab and compare what you find there with what your sentiment chart told you. The gap between the two is the reason this distinction matters.